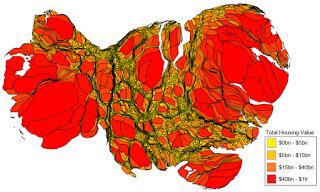
The latest illustration of just how out of whack the Bay Area housing market is shows local counties overwhelming the United States map, when counties are drawn proportionate in size to their property values.
Real estate tracker and data enthusiast Max Galka created the cartogram map and other intriguing visualizations for his website Metrocosm.
“To create the map (above), I took the total residential property value for every county in the U.S. (the contiguous 48 states), and substituted those values for each county’s land area,” said Galka. “Notice what a small portion of the U.S. land area is actually covered by the red counties.”
Here’s a still image explaining how the colors equate to total residential property value:
As you can see, the Bay Area falls entirely within the $40 billion plus range.
Galka recently did similar mapping of property values by state. The above maps mirror those results in that the top five states in terms of property value greatly outweigh the other 43 contiguous states.
“About half of the total value comes from the top five states: California, New York, Florida, Texas, and Pennsylvania, respectively,” wrote Galka.
Things don’t show any signs of slowing down. In San Francisco alone, prices have shot up more than 30% in the last 2 years. Now, Bravo has announced that they will begin airing a reality real estate program called ‘Million Dollar Listing’ featuring Bay Area properties as the star.

